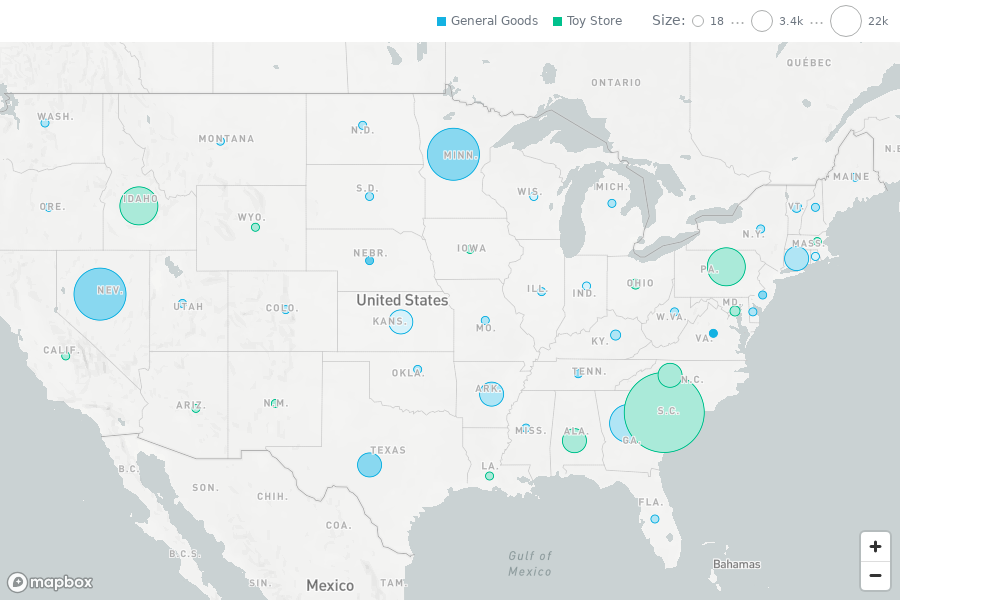
Geo Pushpin Chart
Starting with GoodData.UI Version 8.8, geo pushpin charts are not supported in Internet Explorer 11.
A geo pushpin chart visualizes data broken down by geographic region across an actual map and points the latitude and longitude of locations.

Structure
import "@gooddata/sdk-ui-geo/styles/css/main.css";
import { GeoPushpinChart } from "@gooddata/sdk-ui-geo";

<GeoPushpinChart
    location={<attribute>}
    size={<measure>}
    color={<measure>}
    segmentBy={<attribute>}
    config={<geo-config>}
    …
/>
Example
import "@gooddata/sdk-ui-geo/styles/css/main.css";
import { GeoPushpinChart } from "@gooddata/sdk-ui-geo";
import * as Md from "./md/full";

const config = {
    mapboxToken: "your_mapbox_token",
    tooltipText: Md.City.Name
};

<div style={{ height: 600, width: 900 }}>
    <GeoPushpinChart
        location={Md.City.LOcation}
        size={Md.Population.Sum}
        color={Md.Density.Sum}
        segmentBy={Md.StateName}
        config={config}
    />
</div>
Properties
| Name | Required? | Type | Description |
|---|---|---|---|
| location | true | IAttribute | The attribute definition that determines the longitude and latitude of the pins |
| segmentBy | false | IAttribute | The attribute definition that categorizes the pins |
| size | false | IMeasure | The measure definition that determines the size of the pins |
| color | false | IMeasure | The measure definition that determines color saturation of the pins |
| filters | false | IFilter[] | An array of filter definitions |
| config | true | IGeoConfig | The geo chart configuration object |
| backend | false | IAnalyticalBackend | The object with the configuration related to communication with the backend and access to analytical workspaces |
| workspace | false | string | The workspace ID |
| locale | false | string | The localization of the chart. Defaults to en-US. For other languages, see the full list of available localizations. |
| drillableItems | false | IDrillableItem[] | An array of points and attribute values to be drillable |
| ErrorComponent | false | Component | A component to be rendered if this component is in error state |
| LoadingComponent | false | Component | A component to be rendered if this component is in loading state |
| onError | false | Function | A callback when the component updates its error state |
| onExportReady | false | Function | A callback when the component is ready for exporting its data |
| onLoadingChanged | false | Function | A callback when the component updates its loading state |
| onDrill | false | Function | A callback when a drill is triggered on the component |
Geo Config
| Name | Required? | Type | Description |
|---|---|---|---|
| mapboxToken | true | string | A map access token that the chart uses to render the map requiring such token. To create a Mapbox account and an access token, see this guide. |
| points | false | GeoPointsConfig | A configuration object where you can define clustering and the minimum and maximum sizes of the pins |
| viewport | false | GeoConfigViewport | The region that the viewport should focus after the chart is rendered |
| tooltipText | false | Attribute | An additional item that shows a user-friendly label for the location attribute instead of the longitude and latitude |
For the common chart configuration options such as colors, separators, or legend visibility, see Chart Config.
The following example shows the supported geoConfig structure with sample values:
{
    points: {
        minSize: "0.5x", // "0.5x" | "0.75x" | "normal" | "1.25x" | "1.5x"
        maxSize: "1.5x", // "0.5x" | "0.75x" | "normal" | "1.25x" | "1.5x"
        groupNearbyPoints: true
    },
    viewport: {
        // "auto" // default, Include all data
        // "continent_af" // Africa
        // "continent_as" // Asia
        // "continent_au" // Australia
        // "continent_eu" // Europe
        // "continent_na" // North America
        // "continent_sa" // South America
        // "world";
        area: "world",
    },
    tooltipText: {
        visualizationAttribute: {
            displayForm: {
                identifier: usStateNameIdentifier
            },
            localIdentifier: "usStateNameIdentifier"
        }
    },
    colors: ["rgb(195, 49, 73)", "rgb(168, 194, 86)"],
    colorPalette: [{
        guid: "01",
        fill: {
            r: 195,
            g: 49,
            b: 73
        }
    }, {
        guid: "02",
        fill: {
            r: 168,
            g: 194,
            b: 86
        }
    }],
    colorMapping: [{
        predicate: (headerItem) => {
            return headerItem.attributeHeaderItem && (headerItem.attributeHeaderItem.name === "adult"); // age
        },
        color: {
            type: "guid",
            value: "02"
        }
    }],
    legend: {
        enabled: true,
        position: "top",
    },
    separators: {
        thousand: ",",
        decimal: "."
    }
}
Mapbox token provider
The token provider allows setting of the Mapbox token for whole app or for a part of the app. It is not necessary to provide the token for every chart, insight or dashboard.
Structure
import "@gooddata/sdk-ui-geo/styles/css/main.css";
import { MapboxTokenProvider } from "@gooddata/sdk-ui-geo";

<MapboxTokenProvider
    token={<token>}
>
    ...
</MapboxTokenProvider>
Example
import "@gooddata/sdk-ui-geo/styles/css/main.css";
import { GeoPushpinChart } from "@gooddata/sdk-ui-geo";
import * as Md from "./md/full";

<div style={{ height: 600, width: 900 }}>
    <MapboxTokenProvider token="your_mapbox_token">
        <GeoPushpinChart
            location={Md.City.LOcation}
            size={Md.Population.Sum}
            color={Md.Density.Sum}
            segmentBy={Md.StateName}
        />
    </MapboxTokenProvider>
</div>
Properties
| Name | Required? | Type | Description |
|---|---|---|---|
| mapboxToken | true | string | A map access token that the chart uses to render the map requiring such token. To create a Mapbox account and an access token, see this guide. |
