Pivot Table
Pivot table component expands capabilities of a regular (flat) table by allowing you to reorganize and summarize selected data beyond the typical row-column relationship.
In GoodData.UI, a pivot table allows you to break measures into columns by setting attributes in the columns prop. You can also choose to display only attributes (without any measures). On the other hand, a flat table cannot display attributes in columns.
Compared with charts, pivot tables have higher limits for the number of datapoints to display.
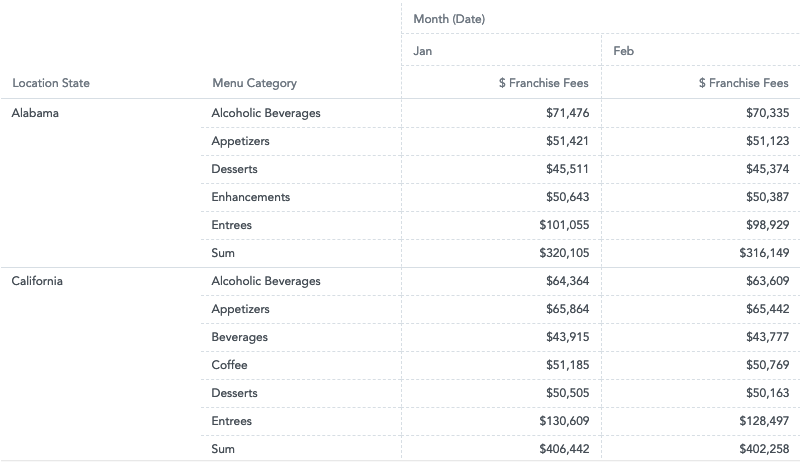
In the following example, we are watching franchise fees (measure) which we split down horizontaly by location state (attribute) and vertically by month (column attribute).

Structure
import '@gooddata/react-components/styles/css/main.css';
import { PivotTable } from '@gooddata/react-components';

<PivotTable
    projectId={<workspace-id>}
    measures={<measures>}
    sdk={<sdk>}
    …
/>
Examples
Pivot table
The following code sample shows an arrangement for a typical pivot table.
const measures = [
    {
        measure: {
            localIdentifier: 'franchiseFees',
            definition: {
                measureDefinition: {
                    item: {
                        identifier: franchiseFeesIdentifier
                    }
                }
            },
            format: '#,##0'
        }
    }
];

const columns = [
    {
        visualizationAttribute: {
            displayForm: {
                identifier: monthDateIdentifier
            },
            localIdentifier: 'month'
        }
    }
];

const rows = [
    {
        visualizationAttribute: {
            displayForm: {
                identifier: locationStateDisplayFormIdentifier
            },
            localIdentifier: 'location'
        }
    }
];

<div style={{ height: 300 }}>
    <PivotTable
        projectId={workspaceId}
        measures={measures}
        rows={rows}
        columns={columns}
    />
</div>
Flat table
You can also use the pivot table component to create a regular (flat) table.
const measures = [
    {
        measure: {
            localIdentifier: 'franchiseFees',
            definition: {
                measureDefinition: {
                    item: {
                        identifier: franchiseFeesIdentifier
                    }
                }
            },
            format: '#,##0'
        }
    }
];

const rows = [
    {
        visualizationAttribute: {
            displayForm: {
                identifier: locationStateDisplayFormIdentifier
            },
            localIdentifier: 'location'
        }
    }
];

<div style={{ height: 300 }}>
    <PivotTable
        projectId={workspaceId}
        measures={measures}
        rows={rows}
        columns={columns}
    />
</div>
Sorting in pivot tables
You can sort rows and attribute columns in any pivot table. Measures are always listed in the same order in which they were defined in the measures prop.
Important! Sorting must be applied to any column attribute that is used in the pivot table. For example, in the table above, you apply sorting to both the Franchise Fees (measure) and the Date (column attribute).
Example: Sorting by measure
// ...using Pivot Table Example

const sortBy = [
    {
        measureSortItem: {
            direction: 'desc',
            locators: [
                {
                    attributeLocatorItem: {
                        attributeIdentifier: 'month',
                        element: monthDateIdentifierJanuary
                    }
                },
                {
                    measureLocatorItem: {
                        measureIdentifier: 'franchiseFeesIdentifier'
                    }
                }
            ]
        }
    }
];

<div style={{ height: 300 }}>
    <PivotTable
        projectId={workspaceId}
        measures={measures}
        rows={rows}
        columns={columns}
        sortBy={sortBy}
    />
</div>
Grouping
The same values in column attributes are grouped across the rows, which helps improve data readability in pivot tables. The header of the grouped columns is displayed at the top of the table even when you scroll through a long group.
The grouping is applied when the following conditions are all met:
- The
groupRowsproperty is set totrue(see Properties). - The table is sorted by the first row attribute (either in ascending or descending order).
- The table has two or more row attributes.

Totals
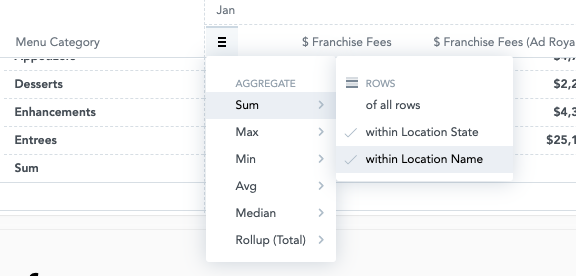
You can display rows with aggregated measure data using the totals prop. For more information, see Specify Table Totals.
Alternatively, you can enable the menu through which you can turn on the totals. For more information, see Configuration menu.

Maximum height
By default, the maximum hight is not specified, and the pivot table fills the whole container. If there is still some empty space within the container after all the rows have been displayed, and the table has a total specified, a gap may appear between the data and the total because the total row sticks to the bottom.
To avoid this gap, specify the maximum height of the table using the maxHeight prop. With the maxHeight set, the table is displayed as small as possible while not expanding beyond the maxHeight limit, thus avoiding the gap. For more information, see Configuration menu.
NOTE: The maxHeight must be specified in pixels. If you want your table to be responsive, consider using react-measure to derive the maxHeight value dynamically.
Configuration menu
You can configure the following settings:
- Separators used when formatting numbers. See Change a separator in the number format.
- Menu items. Currently, only the totals are supported.
- Maximum height. See Maximum height.
const config = {
    maxHeight: 800,
    menu: {
        aggregations: true
    },
    separators: {
        thousand: ',',
        decimal: '.'
    }
};

<PivotTable
    projectId={workspaceId}
    measures={measures}
    rows={rows}
    columns={columns}
    sortBy={sortBy}
    config={config}
/>
Properties
| Name | Required? | Type | Description |
|---|---|---|---|
| projectId | true | string | The workspace ID |
| measures | false | Measure[] | An array of measure definitions (either measures, or rows, or columns must be provided for the pivot table to render properly) |
| rows | false | Attribute[] | An array of attribute definitions that breaks measure data into rows (either measures, or rows, or columns must be provided for the pivot table to render properly) |
| columns | false | Attribute[] | An array of attribute definitions that breaks measure data into columns (either measures, or rows, or columns must be provided for the pivot table to render properly) |
| totals | false | Total[] | An array of total definitions |
| filters | false | Filter[] | An array of filter definitions |
| config | false | ConfigObject | The configuration object |
| sortBy | false | SortItem[] | An array of sort definitions |
| groupRows | false | boolean | Specifies whether grouping of the same values in attribute columns is disabled (false; default) or enabled (true). |
| locale | false | string | The localization of the table. Defaults to en-US. For other languages, see the full list of available localizations. |
| drillableItems | false | DrillableItem[] | An array of points and attribute values to be drillable. |
| sdk | false | SDK | A configuration object where you can define a custom domain and other API options |
| ErrorComponent | false | Component | A component to be rendered if this component is in error state. See ErrorComponent. |
| LoadingComponent | false | Component | A component to be rendered if this component is in loading state. See LoadingComponent. |
| onError | false | Function | A callback when the component updates its error state |
| onExportReady | false | Function | A callback when the component is ready for exporting its data |
| onLoadingChanged | false | Function | A callback when the component updates its loading state |
