Setting Up Custom Visualization
It’s time to start building the visualization itself. If you are an expert in building the custom visualization, this article will be super easy for you! We are going to draw the line chart using Google Charts library.
If you have the visualization already prepared, you can skip this and continue with embedding.
We will use Google Charts. You can also use any Javascript framework like D3.js, find out the the documentation.
You can also check out our end to end examples.
What we already know
See the code below to recap how we can log in to the GoodData and extract data from your project.
google.load("visualization", "1", {packages:["corechart"]});

var projectId = 'project-id',
	user = 'username@company.com',
	passwd = 'password';

// Report elements identifiers from which we execute a GD report
var open = 'aiAY9GSReqiT',
	close = 'aHZY9nzNeg3f',
	year = 'date.aag81lMifn6q';

var elements = [year, open, close];

// Insert info label
$('body').append('<div class="login-loader>Logging in...</div>');

gooddata.user.login(user, passwd).then(function() {

    $('div.login-loader').remove();
    $('body').append('<div class="loading" style="text-align: center; margin: 30px;">Loading data...</div>');

    // Ask for data for the given metric and attributes from the GoodSales project
    gooddata.execution.getData(projectId, elements).then(function(dataResult) {
        // Yay, data arrived
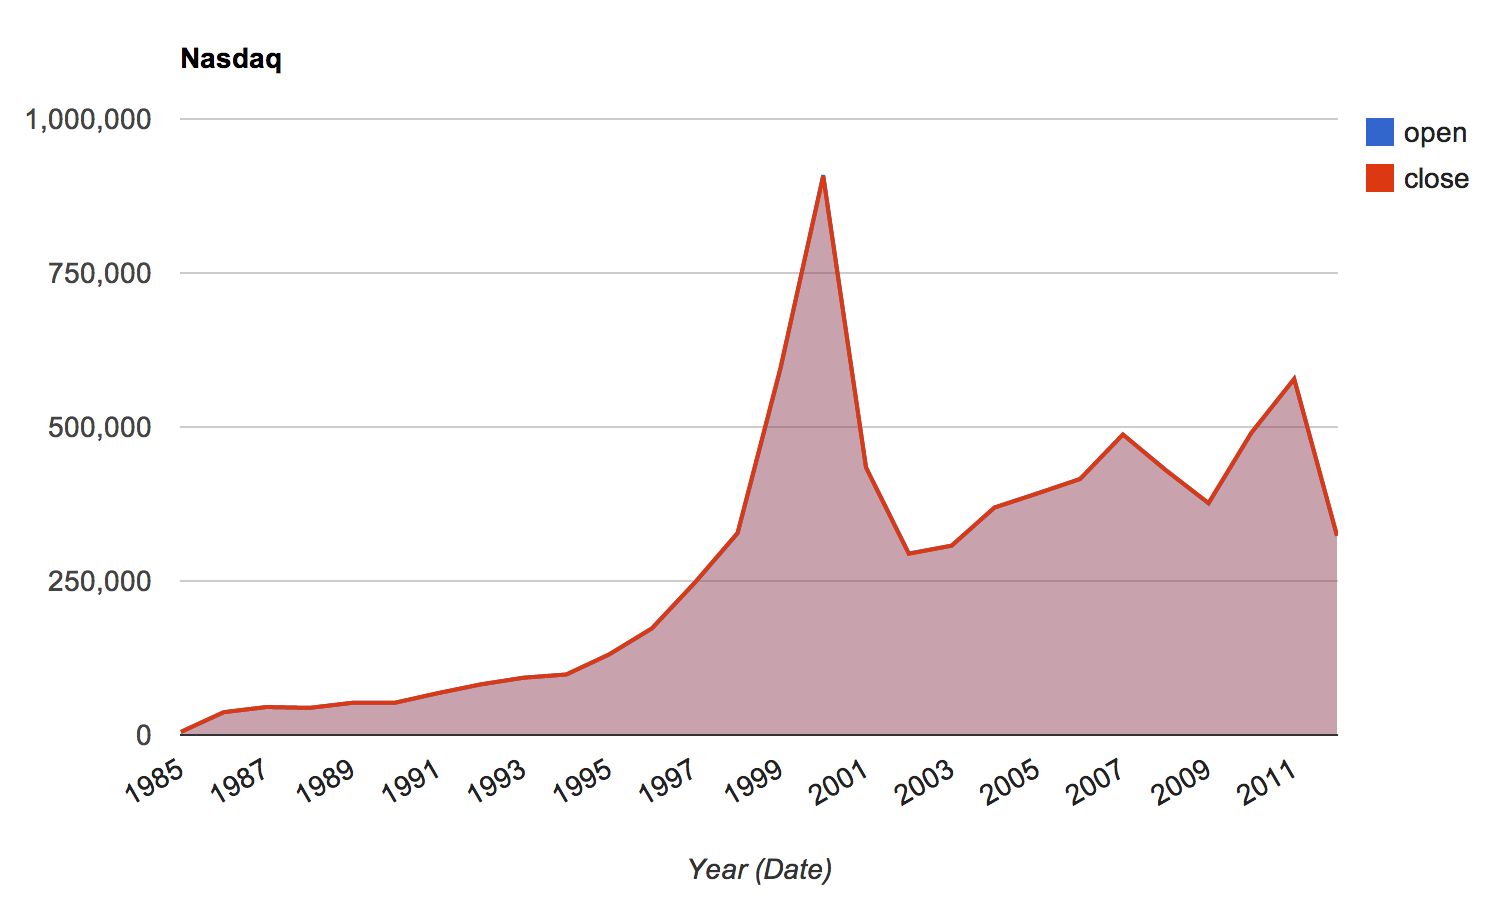
We have a data, let’s build a line chart.
Visualization Set Up

 		// extract header values
        var headers = dataResult.headers.map(function(h) {
                    return h.title;
                });

        // extract raw data matrix
        var data = dataResult.rawData;

		// we need to convert metrics to integer because google chart needs numbers
       	for(var i = 0; i < data.length; i++) {
				for(var j = 1; j < data[i].length; j++) {
				data[i][j] = parseInt(data[i][j]);
			  }
			}
        // Remove loading labels
        $('div.loading').remove();

        // call function back to draw the chart after document is ready
        google.setOnLoadCallback(drawChart(data, headers));

		// function to draw line chart with our data
		function drawChart(data, headers) {

            var data = google.visualization.arrayToDataTable(dataResult.rawData);
            	var data3 = new google.visualization.DataTable();
		    		data3.addColumn('string', headers[0]);
		    		data3.addColumn('number', headers[1]);
		    		data3.addColumn('number', headers[2]);
		    		data3.addRows(data);
		    		console.log(data);

            var options = {
              title: 'Nasdaq',
              hAxis: {title: headers[0],  titleTextStyle: {color: '#333'}},
              vAxis: {minValue: 0}
        };

        var chart = new google.visualization.AreaChart(document.getElementById('chart_div'));
        chart.draw(data3, options);
       }
Complete HTML
The last part is complete html code. See below:
<html>
  <head>
    <script type="text/javascript" src="https://www.google.com/jsapi"></script>
    <script src="//ajax.googleapis.com/ajax/libs/jquery/1.10.2/jquery.min.js"></script>
	<script type="text/javascript" src="../gooddata.js"></script>
  </head>
  <body>
    <div id="chart_div" style="width: 900px; height: 500px;"></div>
  </body>
    <script type="text/javascript" src="linechart.js"></script>
</html>
You can find out complete example as a part of the library you cloned from Github. Try it yourself.