Embedding Viz into the Dashboard
How it works
NOTE: You can only embed custom visualization in white labeled organization.
You store the custom visualization script on a remote location (i.e. S3 bucket) where you can execute it and access it from the browser.
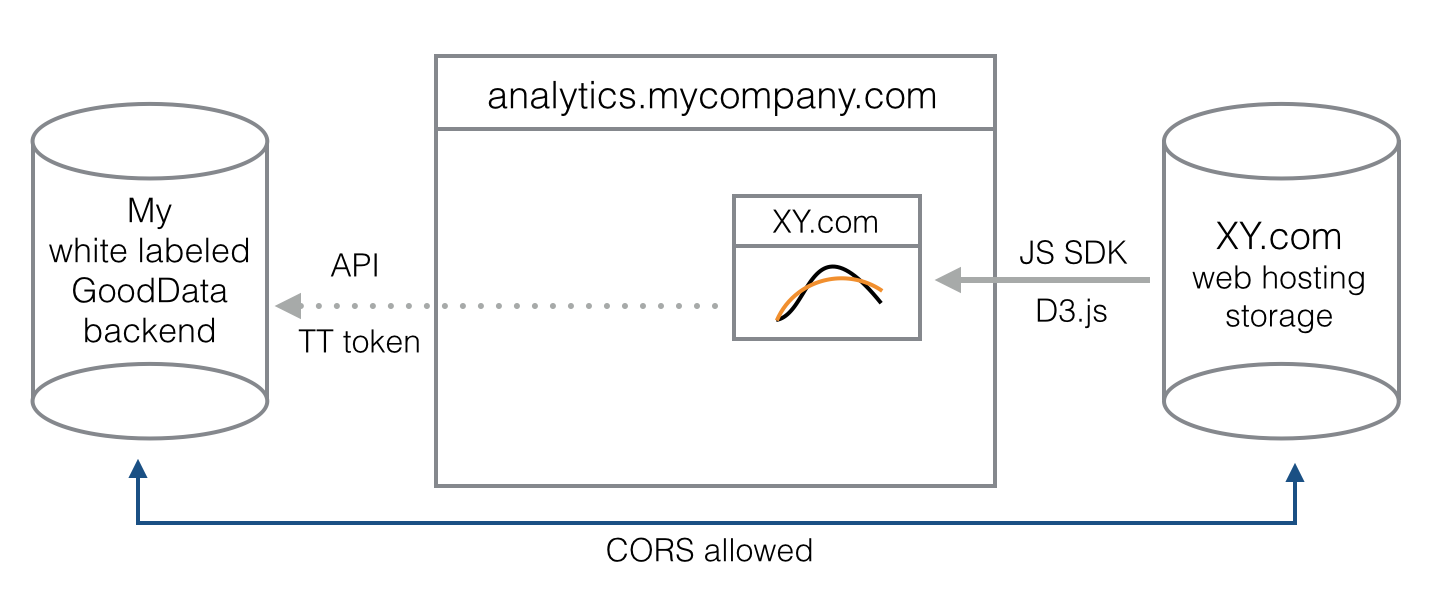
You can embed a custom visualization in a Dashboard in a white labeled organization the same way you embed any other custom HTML code.
CORS must be allowed for your Organization. Feel free to open a ticket with GoodData Support and we will get this set up for you. Once CORS is set up you can place other visualizations in your S3 bucket.
Set up on your side:
Let’s asumme you are using Amazon S3 to store custom visualizations.
1) Add following line of code to set your custom GoodData domain.
	// Fill in your gooddata CORS enabled url (e.g. https://gd.domain.tld)
	gooddata.config.setCustomDomain('<your_gooddata_endpoint>');
2) Put the custom visualization code to the web server (your Amazon S3 bucket) where it will be executed.
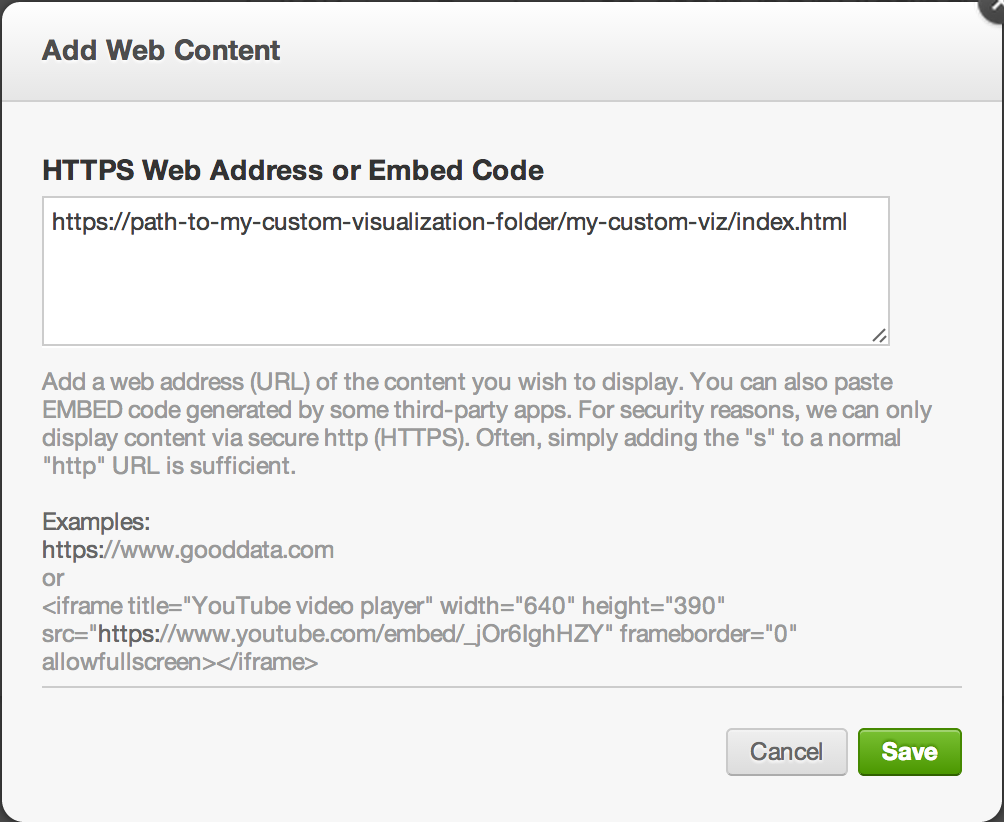
3) Click Edit > Web Content on a dashboard to embed the visualization.
Authentication
To use custom visualization embedded in Dashboard, you don’t need to set up login & password and call the .login method in your script. The visualization is executed in the same browser so standard cookie based authentication is used to call the GoodData backend.
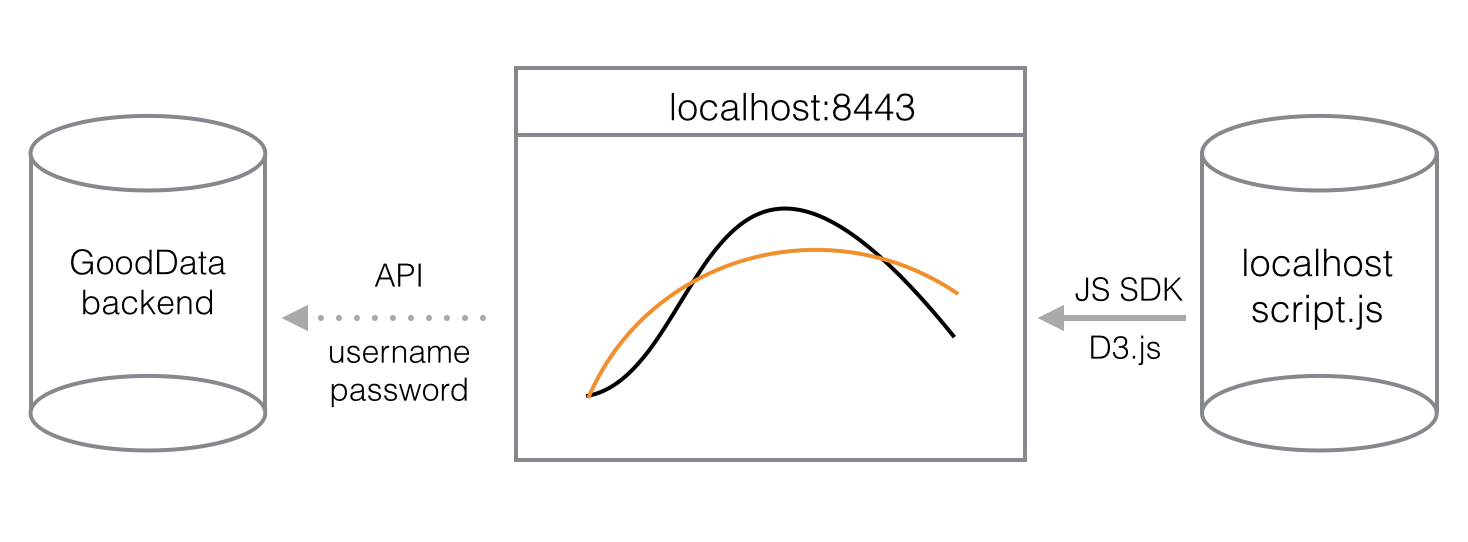
Local Development
You don’t need to have CORS allowed when you are running the script using localhost and grunt. You can automatically access secure.gooddata.com or any server that you choose. See the diagram to understand the difference. Remember that you must use the .login method to call the GoodData backend.