GoodData Platform Introduction
GoodData Platform is a powerful end-to-end analytics platform as a service with multi-tenant distribution that scales to hundreds of terabytes of data and hundreds of thousands of users. Learn more about the GoodData platform and how to embed its analytics possibilities.
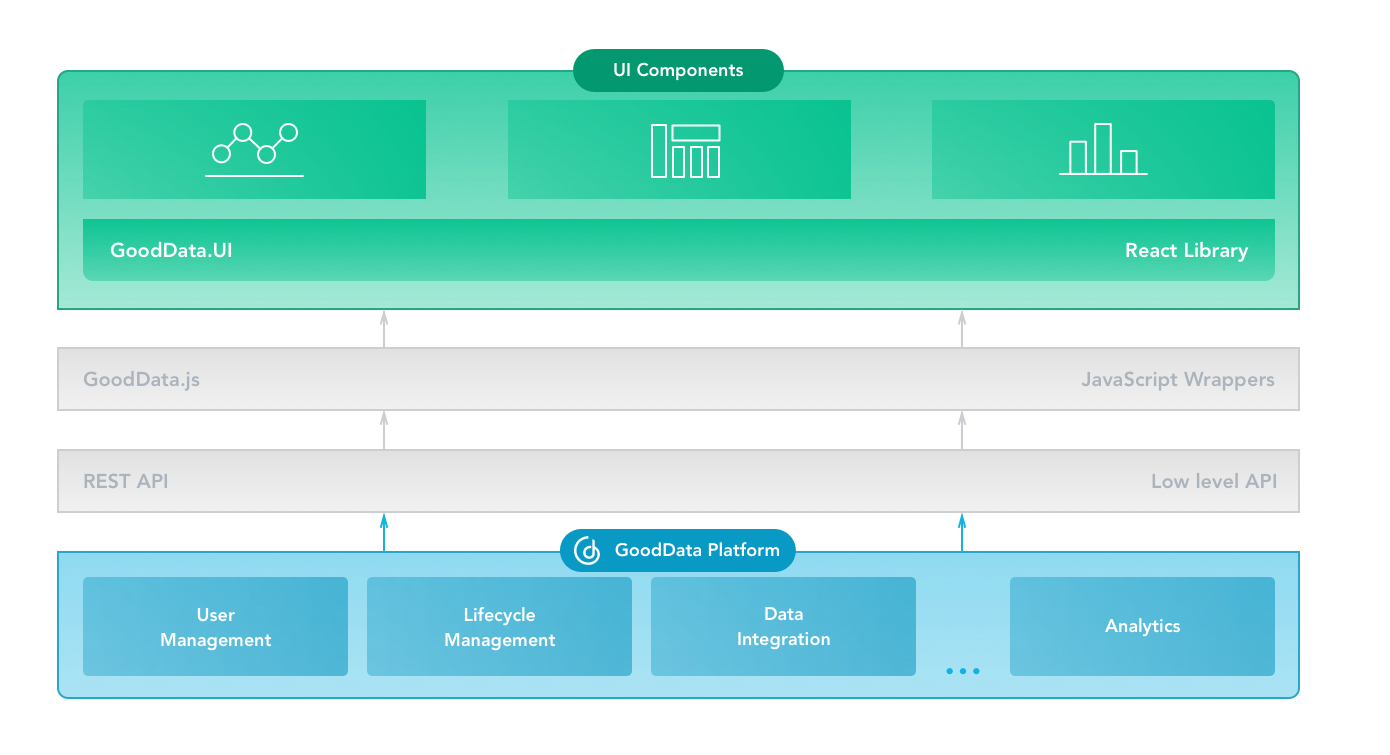
GoodData platform and GoodData.UI

GoodData REST API is a low-level API that makes the platform features accessible to all GoodData users.
GoodData JS is a set of JavaScript wrappers written on top of the REST API. Additionally, GoodData JS handles authentication, unified query request format (AFM, Attributes-Measures-Filters), and many more.
GoodData.UI is a React-based JavaScript library for building responsive analytical applications. This library is written on top of GoodData JS and makes creating analytical applications even more convenient by adding visual components (listed in the left panel under Visual Components).
Main concepts
Imagine you are an account manager for a Franchise network. You want to know the average daily amount of money for each Franchise office in the USA.
Let's introduce the main concepts:
- A measure is a computational expression that aggregates one or more numerical values. In this example, you are interested in the average daily amount.
- An attribute breaks the measure apart and provides context to the data. In this example, the measure is sliced by the location of the Franchise offices.
- A filter is a set of conditions that removes specific values from your original data. In this example, you want to see only USA-specific locations.
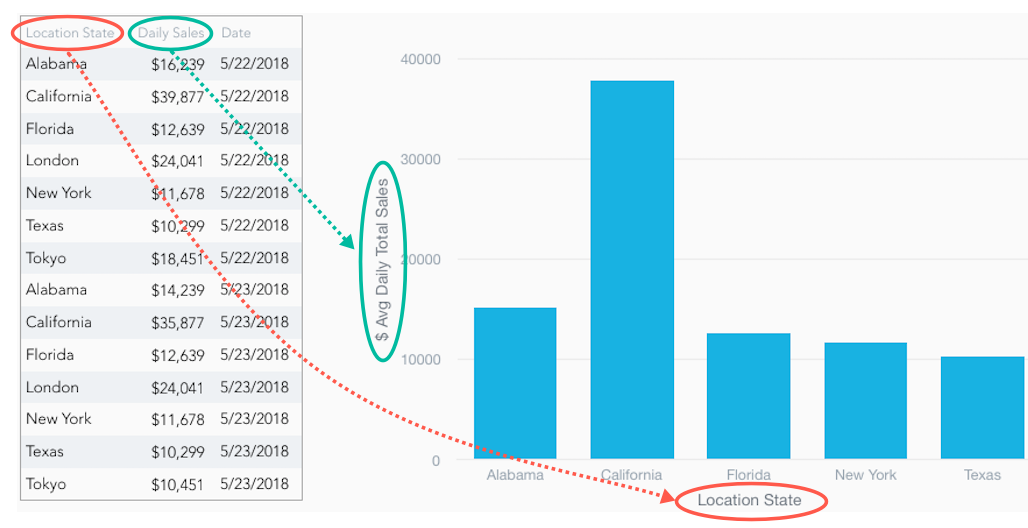
Let's display your data as a column chart:

The chart shows the elements (measure, attribute, filter) that together work as unified input for creating a visualization using GoodData.UI, which is a view into a specific part of your data.
In the column chart:
$ Avg Daily Total Salesis a measure.Location Stateis an attribute.- A filter applied to the chart shows only USA-specific values of
Location State, which represent the offices located in the USA.
