Create Your First Application
This tutorial will guide you through the process of creating your first analytical application using GoodData.UI with the Facebook’s create-react-app tool.
After you complete this tutorial, you will be able to display various measures and charts from your GoodData workspace within the context of your React application.
NOTE: Before you start this tutorial, make sure that you have a GoodData account (see About GoodData.UI).
NOTE: We use yarn dependency manager in this tutorial. To install it, follow its documentation.
Step 1. Get create-react-app
Run the following command from the command line:
yarn global add create-react-app@4
This command installs the create-react-app tool that will help you create a functional skeleton of a React application. We use create-react-app at version 4 because it installs React 16, which is compatible with GoodData.UI. create-react-app version 5 or higher is not supported.
create-react-app version 4 supports TypeScript (@gooddata/typings).
NOTE: The supported versions of Node are ^8.10.0 or >=9.10.0. Using a different version may result in errors.
Step 2. Create your React application
Run the following command from the command line:
create-react-app my-first-appThis command creates a directory named
my-first-appwith a functional skeleton of a React application. You can see the command output that looks something like the following:Success! Created my-first-app at /Users/user-name/dev/my-first-appChange your current working directory to
my-first-app(for example, by runningcd my-first-appon Mac or Linux).
Step 3. Add GoodData SDK dependencies
Run the following command from the command line:
yarn add @gooddata/react-components node-sass
This command adds the latest @gooddata/react-components to the list of your project dependencies in package.json and downloads all required packages.
Step 4. Start the development server
Before you start your development server, prevent cross-origin issues by adding proxy settings. To set up a proxy, in your project's /src directory, create the setupProxy.js file with the following content.
const proxy = require('http-proxy-middleware');

module.exports = function (app) {
     app.use(proxy("/gdc", {
         "changeOrigin": true,
         "cookieDomainRewrite": "localhost",
         "secure": false,
         "target": "https://secure.gooddata.com",
         "headers": {
             "host": "secure.gooddata.com",
             "origin": null
         },
         "onProxyReq": function(proxyReq, req, res) {
             proxyReq.setHeader('accept-encoding', 'identity')
         }
     }));
     app.use(proxy("/*.html", {
         "changeOrigin": true,
         "secure": false,
         "target": "https://secure.gooddata.com"
     }));
     app.use(proxy("/packages/*.{js,css}", {
         "changeOrigin": true,
         "secure": false,
         "target": "https://secure.gooddata.com"
     }));
 };
Careful: Only use the proxy authentication for development. Do not use this authentication method for production.
Careful: If you are only using the development proxy, you will still need to autenticate users by going to
/account.htmlor by calling thesdk.user.login()method, and filling in valid GoodData credentials.
Start the server by running the following command:
- If you are on Mac or Linux:
HTTPS=true yarn start - If you are on Windows:
set HTTPS=true&&npm start
Always run your local development server using HTTPS because the GoodData API responses set cookies with the secure flag. Specifically, it means that if you skip the HTTPS=true part, you will not be able to log in.
Step 5. Establish a session
Open https://localhost:3000/account.html in your browser, and enter your GoodData credentials. You are now logged in to GoodData.
NOTE:
- If you are on Windows and using Microsoft Edge or Internet Explorer, replace
localhostin this URI with the IP address that you get after running the server. - If you see a warning about an insecure connection due to using a self-signed certificate, accept the exception. You can trust your localhost.
For the purpose of this tutorial, you are asked to establish a client session by simply logging in to GoodData.
In your production environment, your end users may be authenticated using single sign-on.
Step 6. Add GoodData components
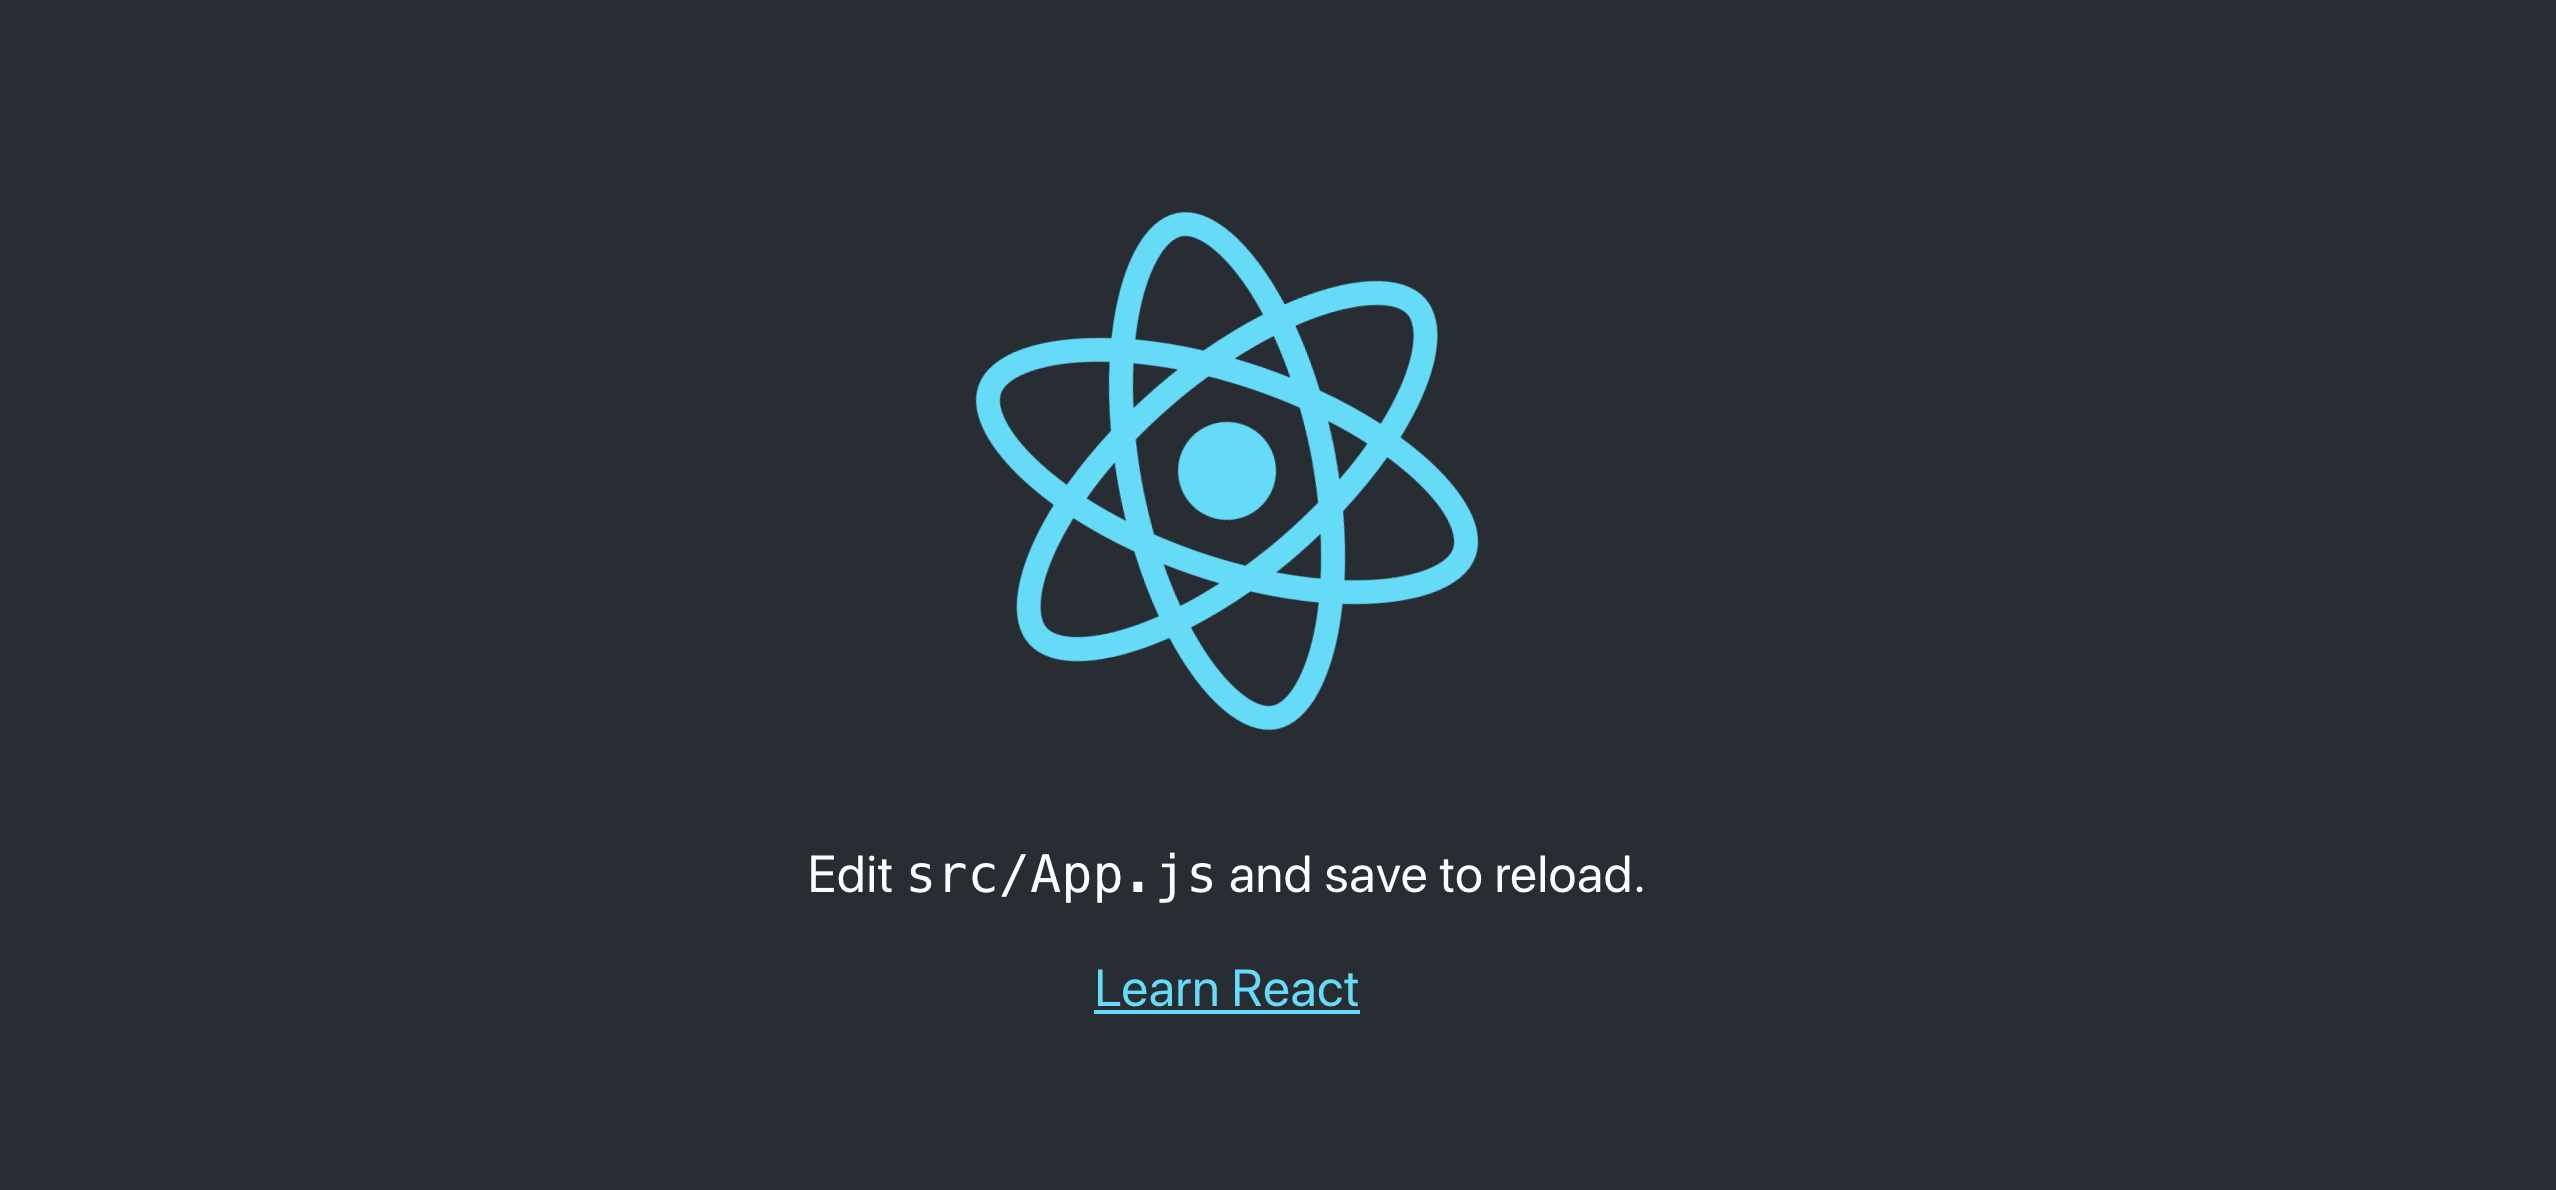
Open https://localhost:3000/ in your browser. The default page generated by the create-react-app tool is displayed and looks like the following example:

Now, you can start adding your first GoodData component:
Open
src/App.jsin a text editor.Add the following line to the other
imports at the beginning of theApp.jsfile:import { LineChart } from '@gooddata/react-components';Add the following line to the other
imports at the beginning of theApp.jsfile to load CSS:import '@gooddata/react-components/styles/css/main.css';Add a simple line chart:
4a. Define measures and attributes.
const measures = [
    {
        measure: {
            localIdentifier: 'franchiseFeesIdentifier',
            definition: {
                measureDefinition: {
                    item: {
                        identifier: 'aaEGaXAEgB7U'
                    }
                }
            },
            format: '#,##0'
        }
    }
];

const attribute = {
    visualizationAttribute: {
        displayForm: {
            identifier: 'date.abm81lMifn6q'
        },
        localIdentifier: 'month'
    }
};
4b. Append the following lines in the
render()method:<div style={{ height: 300 }}> <LineChart projectId='xms7ga4tf3g3nzucd8380o2bev8oeknp' measures={measures} trendBy={attribute} config={{ colors: ['#14b2e2'] }} /> </div>This example uses the workspace ID and measure/attribute identifiers from the live examples. If you want to use this code in your workspace, replace the properties with the appropriate values from your workspace. For more details, see Line Chart.
Save the changes. The content of your
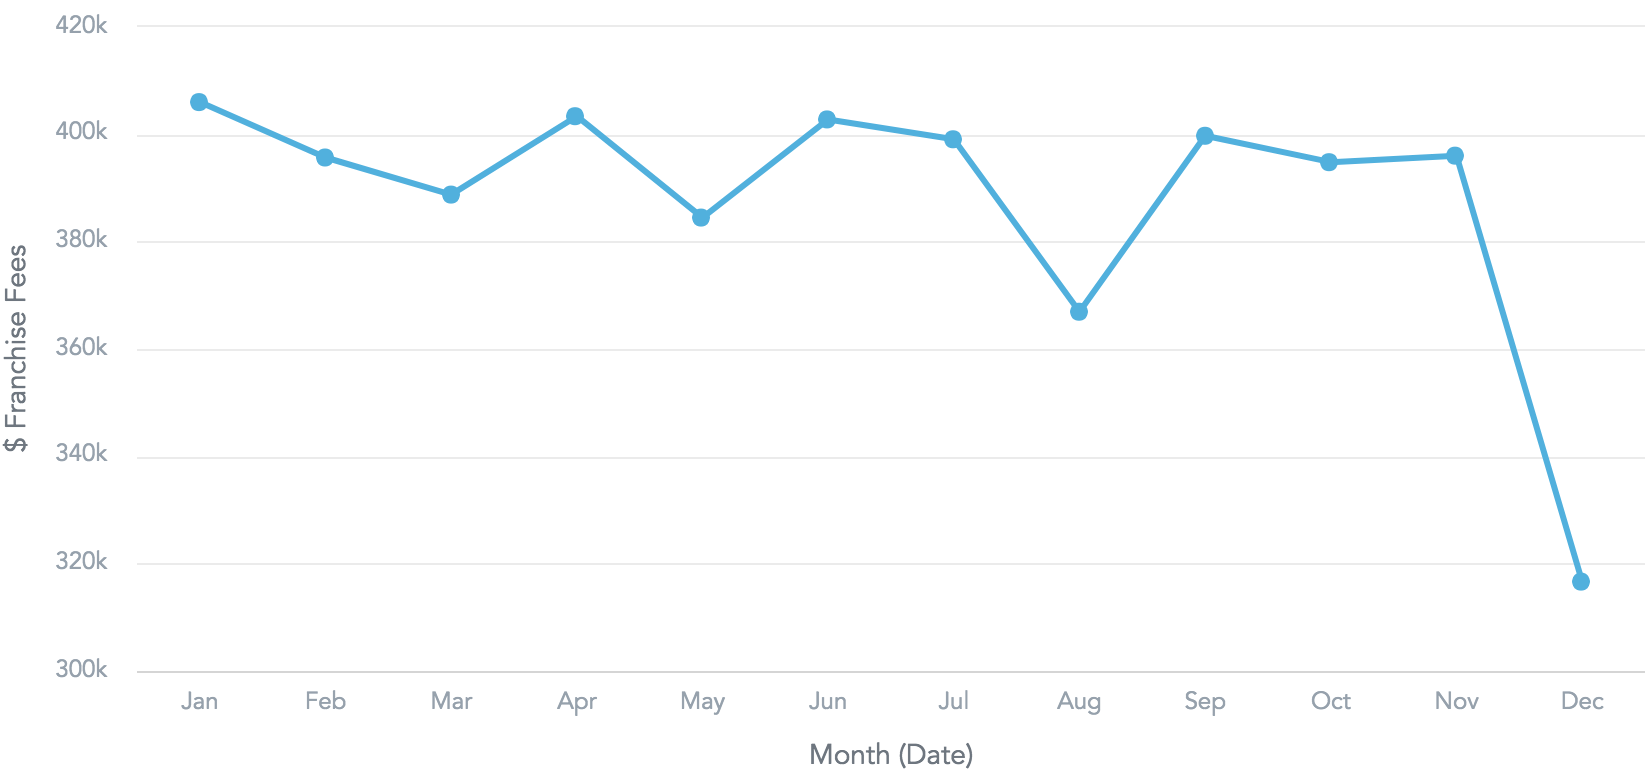
App.jsfile should now look something like the following example:import React, { Component } from 'react'; import { LineChart } from '@gooddata/react-components'; import '@gooddata/react-components/styles/css/main.css'; import logo from './logo.svg'; import './App.css'; const measures = [ { measure: { localIdentifier: 'franchiseFeesIdentifier', definition: { measureDefinition: { item: { identifier: 'aaEGaXAEgB7U' } } }, format: '#,##0' } } ]; const attribute = { visualizationAttribute: { displayForm: { identifier: 'date.abm81lMifn6q' }, localIdentifier: 'month' } }; class App extends Component { render() { return ( <div className="App"> <div className="App-header"> <img src={logo} className="App-logo" alt="logo" /> <h2>Welcome to React</h2> </div> <div style={{ height: 300 }}> <LineChart projectId='xms7ga4tf3g3nzucd8380o2bev8oeknp' measures={measures} trendBy={attribute} config={{ colors: ['#14b2e2'] }} /> </div> <p className="App-intro"> To get started, edit <code>src/App.js</code> and save to reload. </p> </div> ); } } export default App;Return to your browser window. The default page now looks like the following:

Next steps
Here are some suggestions about what you can do after you created your first visualization:
- Add more elements: tables, charts, custom visualizations. For more information, see how to use visual components.
- Enable drilling.
- Authenticate your users using Single Sign-on (SSO) rather than sending them to a proxied GoodData login page.
- Clean up your code.
