Get the Data from GoodData Project
Open your GoodData Project and create the metrics that you want to visualize. You will need identifiers (not URIs!) to specify the objects to export. The easiest way to get the metric identifier is to use our grey pages here:
https://secure.gooddata.com/gdc/md/{project-id}/query/metrics
navigate to your metric, open it and locate its identifier key and copy its value. You can also use API directly to get metric identifiers.
GoodData Project
If you don’t have a GoodData project, you can create one using our Ruby SDK.
We want to see open and close quote of Nasdaq during the time. Let’s use following metrics:
open: aiAY9GSReqiT
close : aHZY9nzNeg3f
Select the sales rep attribute identifier from the project:
Year (Date): date.aag81lMifn6q
The first lines of the code specify the project id, user credentials and report elements. By report elements we mean metrics and attributes.
NOTE: Credentials are just for your local developer environment. If you want to embed custom visualization to your dashboard, you don’t need them. Learn more about embedding custom visualization.
	var projectId = 'project-id',
		user = 'username@company.com',
		passwd = 'password';

	// Report elements identifiers from which we execute a GD report
	var open = 'aiAY9GSReqiT',
		close = 'aHZY9nzNeg3f',
		year = 'date.aag81lMifn6q';
The next step is all about the Javascript methods that call the GoodData APIs to authenticate and extract the data based on the metrics and attributes from the code above.
See the following script, particularly the gooddata.user.login and gooddata.execution.getData methods.
var elements = [year, open, close];

// Insert info label
$('body').append('<div class="login-loader">Logging in...</div>');

gooddata.user.login(user, passwd).then(function() {

    $('div.login-loader').remove();
    $('body').append('<div class="loading">Loading data...</div>');
Here we go. This is the key part. The gooddata.execution.getData method executes report and gives you data.
gooddata.execution.getData(projectId, elements).then(function(dataResult) {
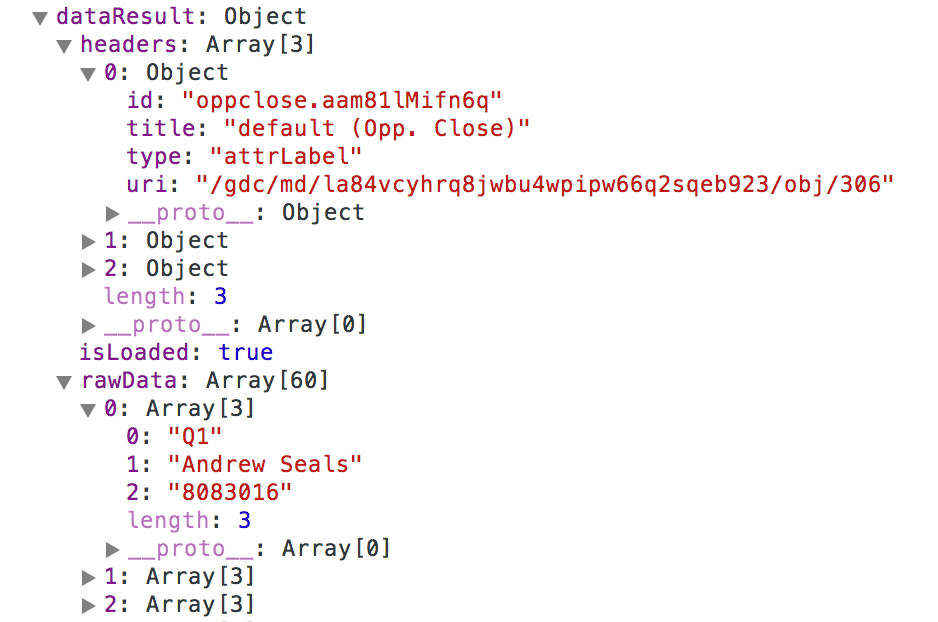
You have successfully extracted the data from GoodData Platform and now have all data that you have specified in the browser. You can now use the D3.js (or any other viz framework) to create the custom visualization. The structure that the getData() method returns to you is an object. This object contains of two arrays:
- headers: array of objects with header information and data
- rawData: array with the data for each row
- isLoaded: parameter that you can check for better handling (true/false)
The rawData array returns the data in in the same column order as you specified in the element variable on the top of your script.
Perfect. Your data is extracted from the GoodData Platform with the SDK, and now it’s up to you how you transform it. We have created multiple examples to inspire you.