Dynamic dc.js Visualization
Talking about visualization frameworks and libraries the dc.js together with Crossfilter is great combo on the top of D3.js framework. There is a solid amount of examples around the internet so that you can start playing around immediately.
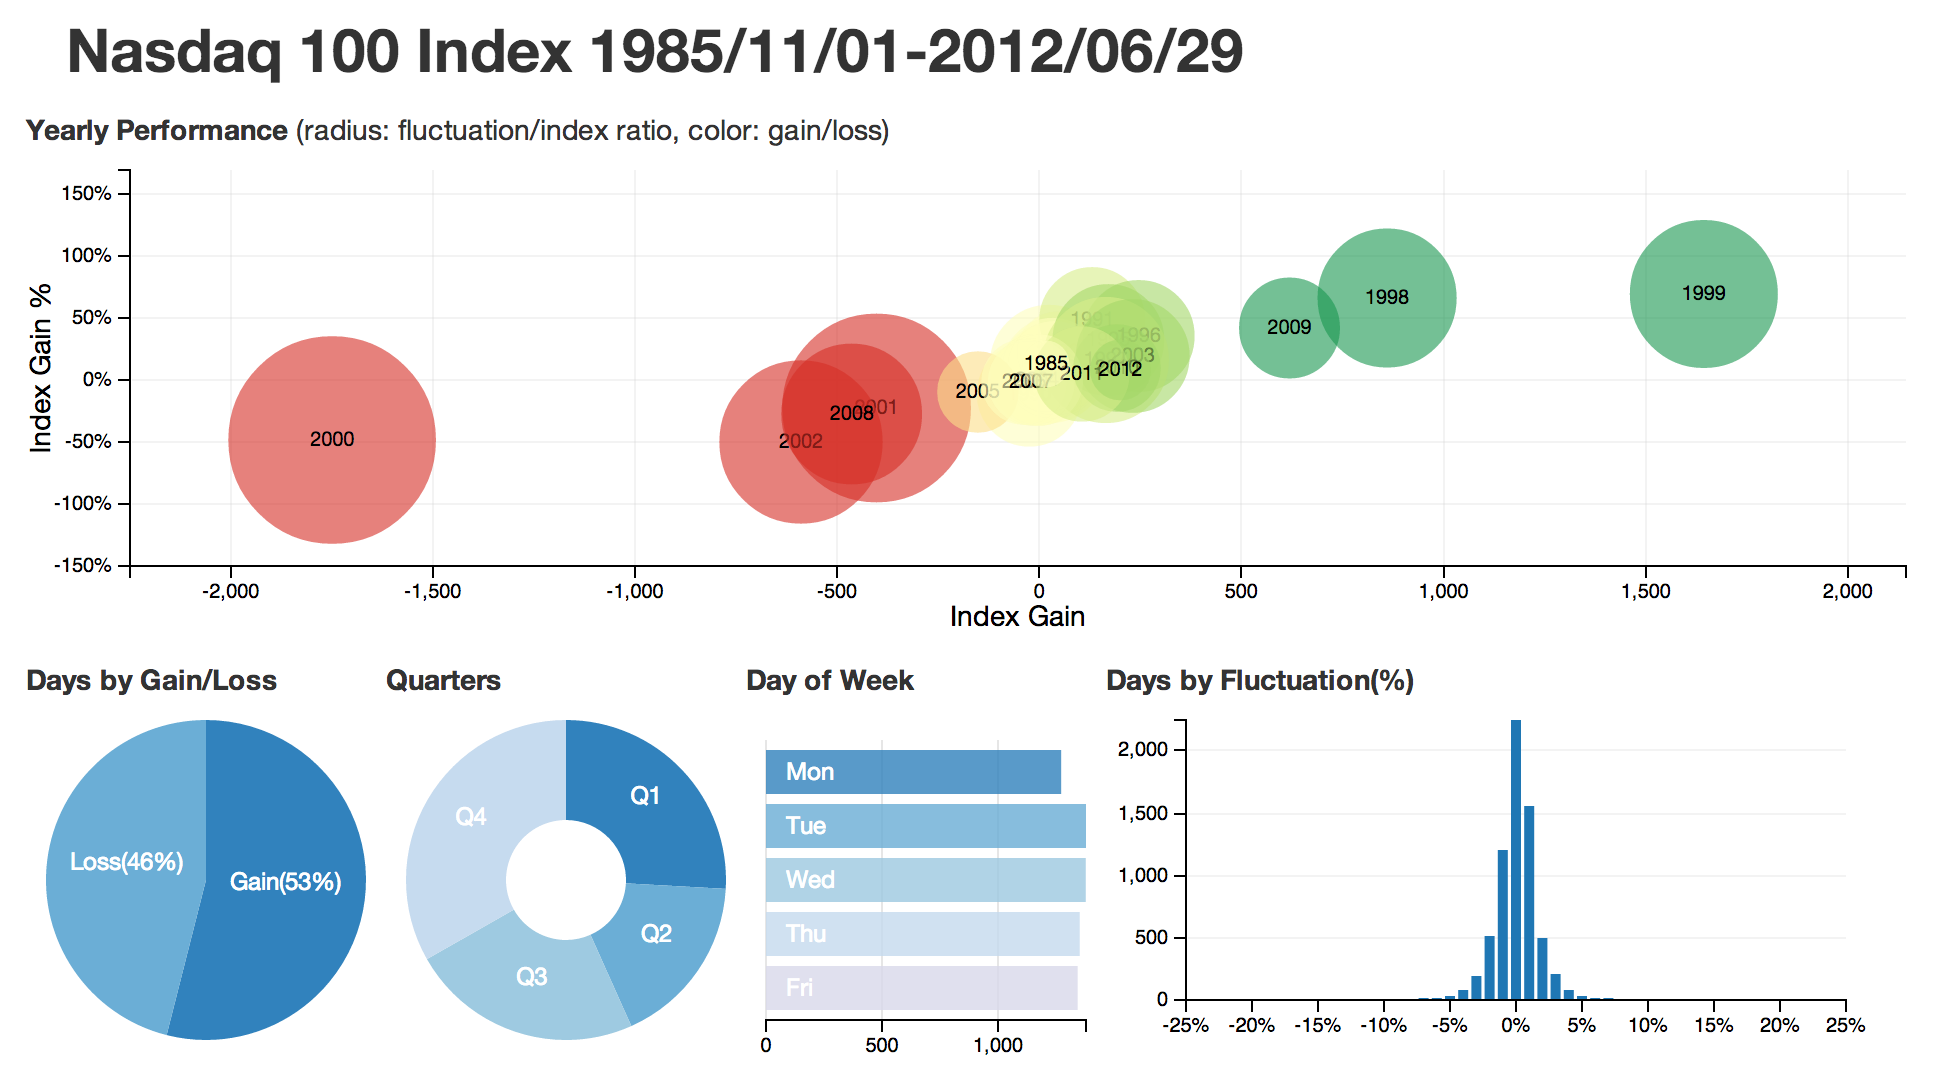
We took the example from the dc.js homepage which looks pretty cool and is greatly and fully described and try to bring it to the next level. What we did? The original example is based on static CSV file. What is really cool? You can quite easily connect it to the GoodData Platform, get the data from your Project and use the visualization embedded to your dashboard. This is what we called Visualization Extensibility.
So let’s say we have a GoodData Project with Nasdaq data in it. See the example report below:
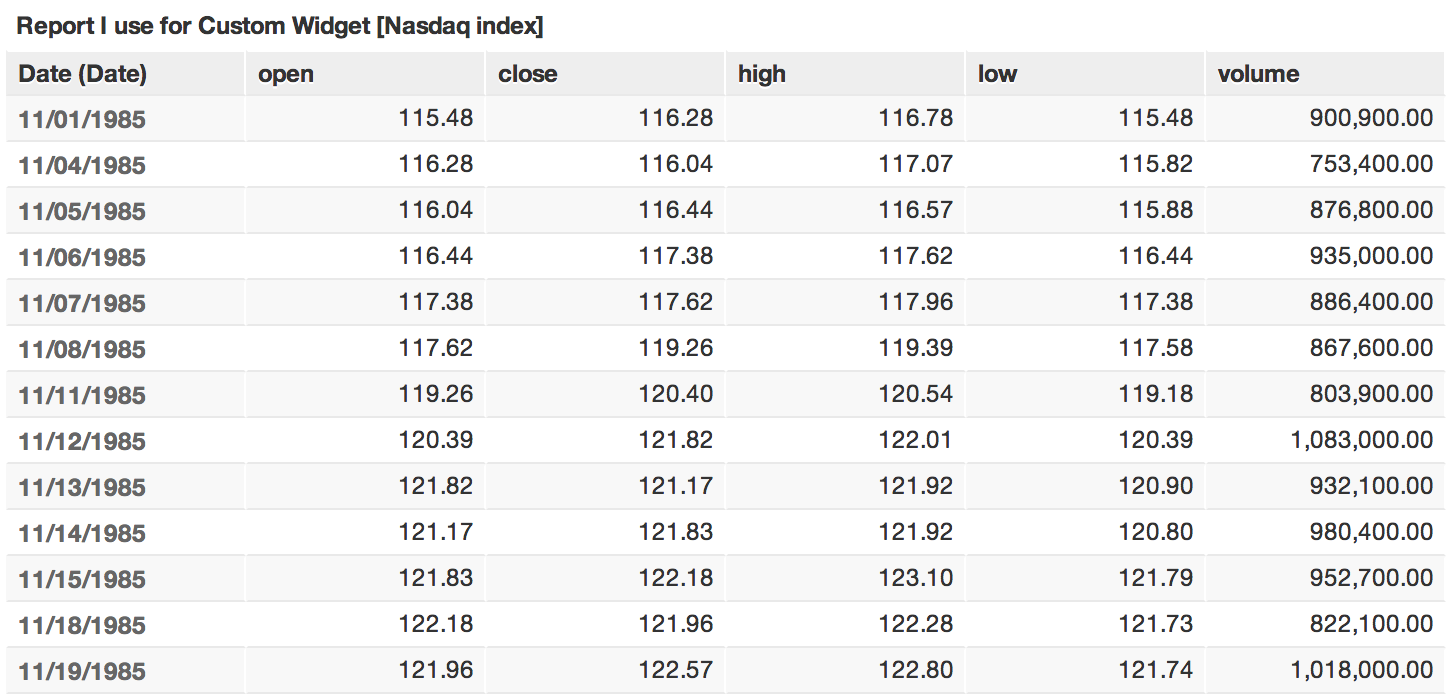
The potential is huge! If you miss some visualization, just build it and embed it directly to the GoodData Project!
The full script is in the example folder of the Visualization SDK library.
Prerequisites
- Downloaded dc.js & Crossfilter
- Have the data in the GoodData Project that you can visualize (you can build example project using this script)
Integration
The main change is in the beggining of the script, you basically specify which metrics are being extracted from the GoodData:
var projectId = 'project-id',
    user = 'username@company.com',
	passwd = 'password';

// Report elements identifiers from which we execute a GD report
var open = 'ak6IS471fqU4',
	high = 'an3ISF1EiuFv',
	low = 'apiISRdbfmS7',
	close = 'adCISUDJfpJW',
    volume = 'adCISXzgiy3t',
    date = 'date.date.mmddyyyy';

var elements = [date, open, high, low, close, volume];
Remember that order you specify in the elements array is the same that the elements will be exported from the GoodData.
Let’s download the data now. It is the same as for our othe examples. We need to do a little work with the output so that it fits the Crossfilter library.
gooddata.user.login(user, passwd).then(function() {

    $('div.login-loader').remove();
    $('body').append('<div class="loading" style="text-align: center; margin: 30px;">Loading data...</div>');

    // Ask for data for the given metric and attributes from the GoodSales project
    gooddata.execution.getData(projectId, elements).then(function(dataResult) {
        // Yay, data arrived

        var headers = dataResult.headers.map(function(h) {
                    return h.title;
                }),
		data = [];

		//Object -> Array so that dc.js can consume it
		dataResult.rawData.forEach(function (arr) {
					var rv = {};
					for	(var i = 0; i < arr.length; ++i)
					rv[i] = arr[i];
					data.push(rv);
					});

		// Remove loading labels
        $('div.loading').remove();

		var dateFormat = d3.time.format("%m/%d/%Y");
		var numberFormat = d3.format(".2f");

		data.forEach(function (d) {
    		d.dd = dateFormat.parse(d[0]);
    		d.month = d3.time.month(d.dd); // pre-calculate month for better performance
    		d[4] = +d[4]; // coerce to number
    		d[1] = +d[1];
    		});
The rest of the script is basically the same as in the original example so that you can read the details. Only change is the name on keys in the objects because the Javascript SDK returns you numeric keys so the names are different.
Download the full example to start playing around! You can also find it directly in your repository (example folder).