Building Parallel Coordinates
Let’s learn how to create a custom visualization with our Javascript Visualization SDK and embed it to your dashboard. The tutorial is divided into several logical parts based on steps that you have to accomplish. You can also explore the complete example that is also available in your forked repository (examples folder)
What we are going to build is the visualization that is called Parallel Coordinates. It shows one attribute measured by multiple metrics. Imagine a following use case:
“Chief Revenue Officer wants to compare Sales Reps not only by the Revenue but also by their activity and number of Opportunities and one other metrics.”
The result might looks like this:
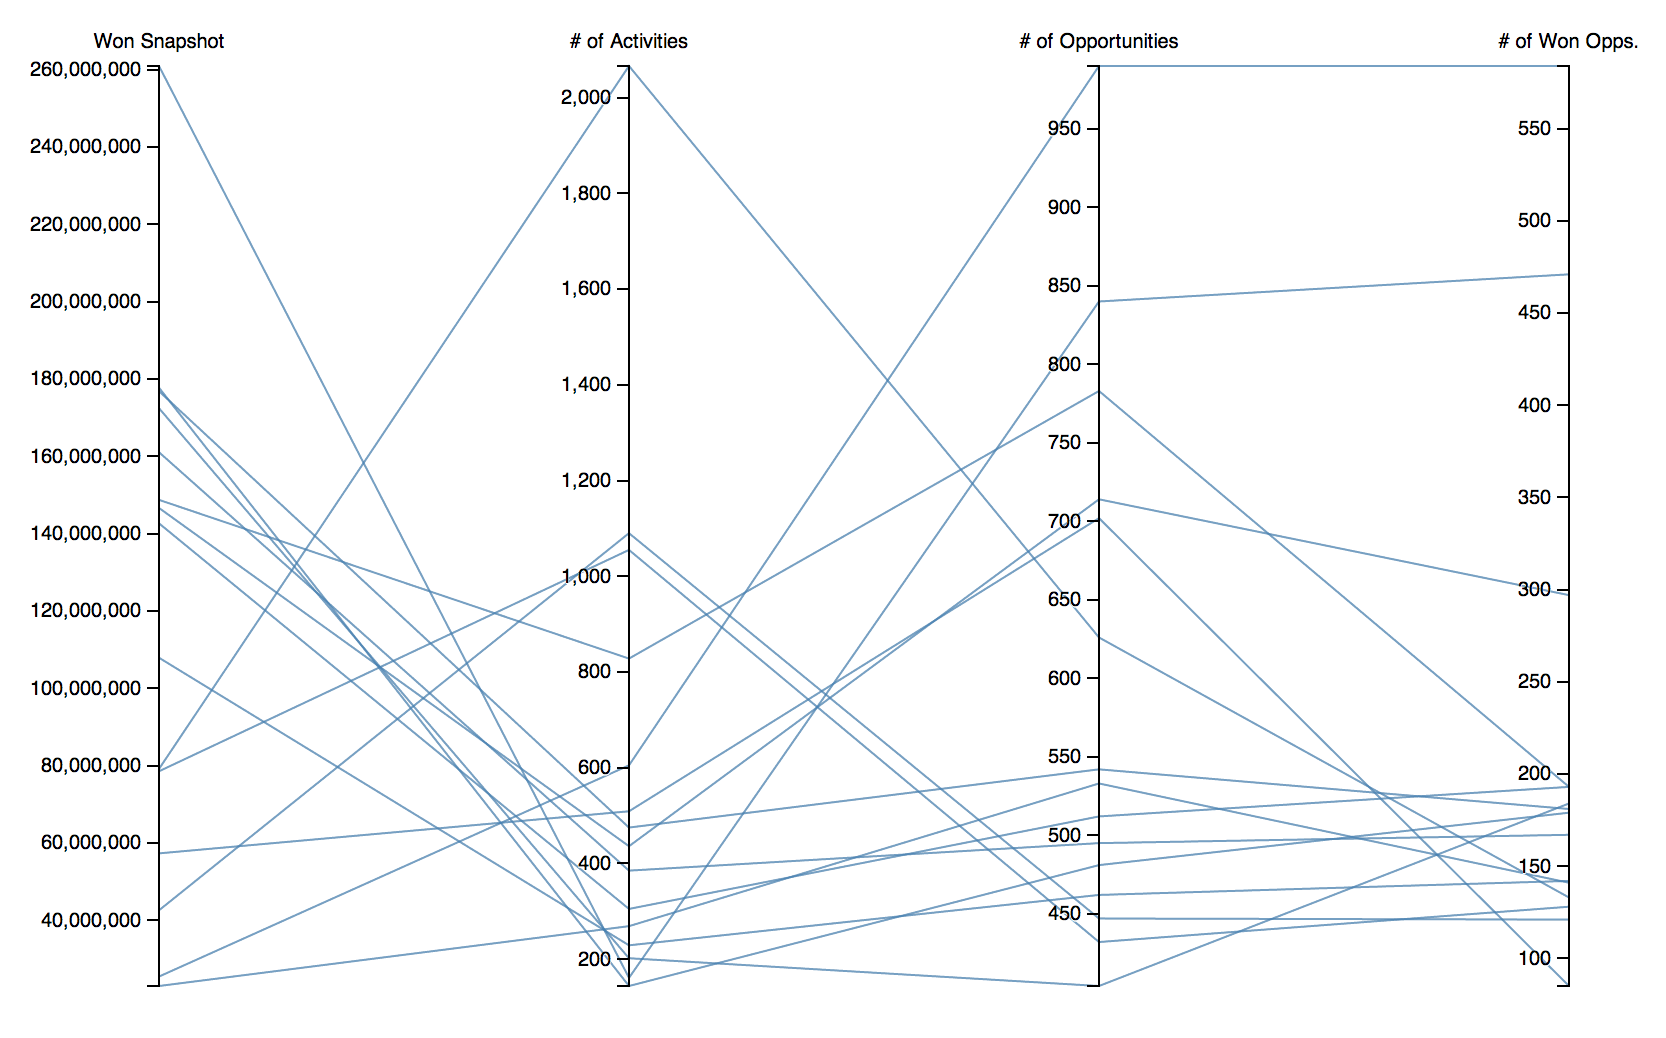
Remember that each line shows individual sales rep and each axis shows one metric that is used to measure sales representatives. We have a use case, so let’s build it!
We need following metrics (remember to check identifiers in your project):
Won Amount: atX3I1GYg85J # Activities : acKjadJIgZUN # Opportunities: afdV48ABh8CN # Won Opportunities: abf0d42yaIkL
Select the sales rep attribute identifier from the project:
Opportunity Owner: label.opp_owner.id.name
Let’s log in and download the data. I already have those metrics ready in the GoodData. Now I need to select them and use them in the visualization.
var projectId = 'project-id',
    user = 'username@company.com',
	passwd = 'password';

// Report elements identifiers from which we execute a GD report
var metric1 = 'atX3I1GYg85J',
    metric2 = 'acKjadJIgZUN',
    metric3 = 'afdV48ABh8CN',
    metric4 = 'abf0d42yaIkL',
    attr1 = 'label.opp_owner.id.name';

var elements = [attr1, metric1, metric2, metric3, metric4];

// Insert info label
$('body').append('<div class="login-loader">Logging in...</div>');

gooddata.user.login(user, passwd).then(function() {

    $('div.login-loader').remove();
    $('body').append('<div class="loading">Loading data...</div>');

    // Ask for data for the given metric and attributes from the GoodSales project
    gooddata.execution.getData(projectId, elements).then(function(dataResult) {
        // Yay, data arrived

        // Remove loading labels
        $('div.loading').remove();
Now, it’s time to start building the D3 visualization itself. If you are an expert in building the D3 custom visualization, this article will be super easy for you! We are going to draw the Parallel Coordinates chart to compare one attribute across four different metrics.
var m = [30, 10, 10, 10],
	w = 960 - m[1] - m[3],
    h = 500 - m[0] - m[2];

var x = d3.scale.ordinal().rangePoints([0, w], 1),
    	y = {},
    	dragging = {};

var line = d3.svg.line(),
    	axis = d3.svg.axis().orient("left"),
    	background,
    	foreground;

var svg = d3.select("body").append("svg:svg")
    	.attr("width", w + m[1] + m[3])
    	.attr("height", h + m[0] + m[2])
    	.append("svg:g")
    	.attr("transform", "translate(" + m[3] + "," + m[0] + ")");
The main method that draw the visualization.
// the main method that extract data and draw the visualization
var parallel = function(dataResult) {

		// extract header titles for axis description
        var headers = dataResult.headers.map(function(h) {
                return h.title;
            });

    		    // delete the attribute (first in returned array) description from header array - you need just metrics description
                headers.splice(0,1);

    	// Extract the list of dimensions and create a scale for each.
    	x.domain(dimensions = d3.keys(dataResult.rawData[0]).filter(function(d) {
    	 	return d != "0" && (y[d] = d3.scale.linear()
    	 .domain(d3.extent(dataResult.rawData, function(p) { return +p[d]; }))
    	 .range([h, 0]));
    	 }));

    	  // Add grey background lines for context.
    	  background = svg.append("svg:g")
    	      .attr("class", "background")
    	    .selectAll("path")
    	      .data(dataResult.rawData)
    	    .enter().append("svg:path")
    	      .attr("d", path);

    	  // Add blue foreground lines for focus.
    	  foreground = svg.append("svg:g")
    	      .attr("class", "foreground")
    	    .selectAll("path")
    	      .data(dataResult.rawData)
    	    .enter().append("svg:path")
    	      .attr("d", path);

    	  // Add a group element for each dimension.
    	  var g = svg.selectAll(".dimension")
    	      .data(dimensions)
    	    .enter().append("svg:g")
    	      .attr("class", "dimension")
    	      .attr("transform", function(d) { return "translate(" + x(d) + ")"; })
    	      .call(d3.behavior.drag()
    	        .on("dragstart", function(d) {
    	          dragging[d] = this.__origin__ = x(d);
    	          background.attr("visibility", "hidden");
    	        })
    	        .on("drag", function(d) {
    	          dragging[d] = Math.min(w, Math.max(0, this.__origin__ += d3.event.dx));
    	          foreground.attr("d", path);
    	          dimensions.sort(function(a, b) { return position(a) - position(b); });
    	          x.domain(dimensions);
    	          g.attr("transform", function(d) { return "translate(" + position(d) + ")"; })
    	        })
    	        .on("dragend", function(d) {
    	          delete this.__origin__;
    	          delete dragging[d];
    	          transition(d3.select(this)).attr("transform", "translate(" + x(d) + ")");
    	          transition(foreground)
    	              .attr("d", path);
    	          background
    	              .attr("d", path)
    	              .transition()
    	              .delay(500)
    	              .duration(0)
    	              .attr("visibility", null);
    	        }));

    	  // Add an axis and title.
    	  g.append("svg:g")
    	      .attr("class", "axis")
    	      .each(function(d) { d3.select(this).call(axis.scale(y[d])); })
    	    .append("svg:text")
    	      .data(headers)
    	      .attr("text-anchor", "middle")
    	      .attr("y", -9)
    	      .text(String);

    	  // Add and store a brush for each axis.
    	  g.append("svg:g")
    	      .attr("class", "brush")
    	      .each(function(d) { d3.select(this).call(y[d].brush = d3.svg.brush().y(y[d]).on("brush", brush)); })
    	    .selectAll("rect")
    	      .attr("x", -8)
    	      .attr("width", 16);
    };
Call the main method that draw the visualization.
		// calling the main method
		parallel(dataResult);
Finalize the dragging and transition effects.
		function position(d) {
			var v = dragging[d];
			return v == null ? x(d) : v;
			}

			function transition(g) {
				return g.transition().duration(500);
			}

			// Returns the path for a given data point.
			function path(d) {
			  return line(dimensions.map(function(p) { return [position(p), y[p](d[p])]; }));
			}

			// Handles a brush event, toggling the display of foreground lines.
			function brush() {
			  var actives = dimensions.filter(function(p) { return !y[p].brush.empty(); }),
			      extents = actives.map(function(p) { return y[p].brush.extent(); });
			  foreground.style("display", function(d) {
			    return actives.every(function(p, i) {
			      return extents[i][0] <= d[p] && d[p] <= extents[i][1];
			    }) ? null : "none";
			  });
			}

		});
});
That’s all. Download the full example to try it out easily.